
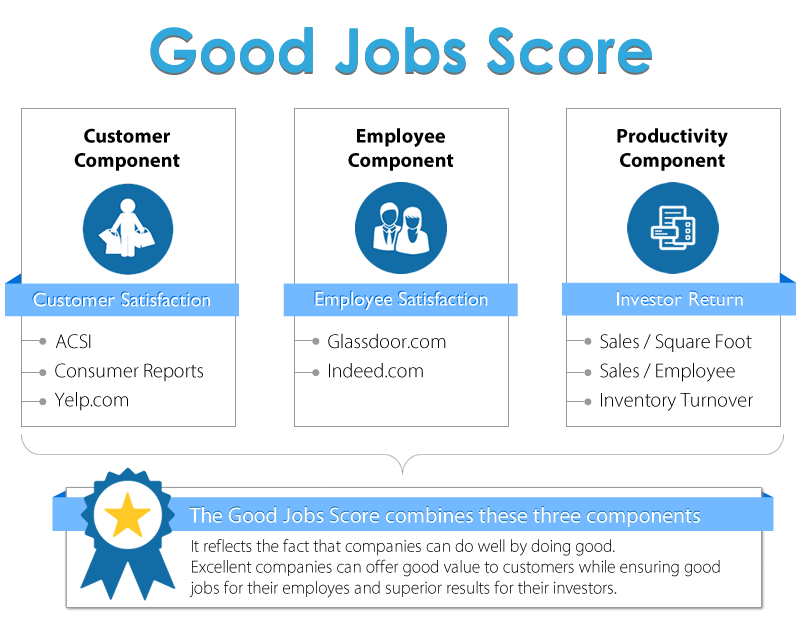
Companies that follow a Good Jobs Strategy design and manage their operations in a way that allows them to achieve three outcomes at the same time:
- High customer satisfaction
- High employee satisfaction
- High productivity
We collect and aggregate data on customer satisfaction, employee satisfaction, and productivity to create the Good Jobs Score, which is a relative score within an industry. As we note below, the data we use are limited. But they are the best publicly available data we could find. Over time, we hope that investors will demand better data and companies or third parties will respond by creating and reporting standardized measures of customer satisfaction, employee satisfaction and productivity.
Company Selection
The first industry we examine is grocery/food retailing. We are hoping to get feedback on our methodology, refine it, and then scale the Good Jobs Score to different industries.
The companies analyzed were selected from the group of retailers identified with the SIC code #5411 – Grocery Stores, as determined by the U.S. Department of Labor, Occupational Safety & Health Administration (OSHA). All grocery stores in this category that publicly filed with the S.E.C. and operated in the U.S. in 2014 were considered. In addition, three U.S. retailers that carry groceries were considered — Costco (SIC code #5399 – Miscellaneous General Merchandise Stores), Target (SIC code #5331 – Variety Stores) and Walmart (SIC code #5331 – Variety Stores).
Score Computation
Component scores (

")
")
The overall score (
G ... overall score

c ... component score (employee, customer, productivity)

s ... sub-score within component (e.g. ACSI, CR)

o ... sub-component score in original scale

i ... company index

j ... component index

k ... sub-score index

L ... # of components

M ... # of sub-scores

N ... # of companies

max(c) = 10.0

min(c) = 1.0

range(c) = max(c) - min(c)
Formulas
}{range(o_{j,k})}*range(c)+min(c)")

![G_{i} = \sqrt[L]{\prod_{j=1}^{L}c_{i,j}}](http://s0.wp.com/latex.php?latex=G_%7Bi%7D+%3D+%5Csqrt%5BL%5D%7B%5Cprod_%7Bj%3D1%7D%5E%7BL%7Dc_%7Bi%2Cj%7D%7D&bg=ffffff&fg=000&s=2 "G_{i} = \sqrt[L]{\prod_{j=1}^{L}c_{i,j}}")
Customer Component
We use data from American Customer Satisfaction Index (ACSI), Consumer Reports (CR), and Yelp.com to create the Customer Score.
ASCI, developed at University of Michigan, conducts phone surveys with customers to develop a satisfaction score for each company. ASCI has been used in a wide range of contexts and has been shown to be a leading indicator of company’s financial performance. Where ACSI provides multiple scores for a company in different industries, we use the mean of those scores. In cases where there are two ACSI scores for multiple retail names under the same corporation, we use the average ACSI score weighted by revenue.
The Consumer Report Ratings are based on 62,917 responses to the Consumer Reports’ 2014 Supermarket Survey, reflecting readers’ 111,208 shopping trips between March 2013 and July 2014 and don’t necessarily mirror the experiences of the general population. The results reflect respondents’ overall satisfaction with the shopping experience as described in that survey and are limited to that specific purpose. Because Consumer Reports provides its survey ratings on a retail name level, we use the average of those scores weighted by the number of stores for a corporation.
Yelp.com has collected over 77 million reviews from customers who provide a rating as well as a qualitative review of their experience with local companies. Respondents to Yelp.com are self-selecting and thus the data cannot be considered to have been gathered from a random sample of customers. For the 14 companies in our data, the correlation between Yelp and Consumer Reports is 0.79 and between Yelp and ASCI is 0.93.
Employee Component
We use data from Glassdoor.com and Indeed.com to create the Employee Score. Both sites collect data from employees who provide salary and other employment related information. Employees also rate their companies on a wide range of employee satisfaction measures. For Glassdoor.com, all but four of the companies had a number of respondents above 500 — Ingles (151 respondents), Roundy’s (348 respondents), Sprouts (316 respondents) and Weis (181 respondents). Walmart and Target both have over 10,000 respondents. For Indeed.com, all but three of the companies had a number of respondents above 500 — Ingles (126 respondents), Sprouts (283 respondents) and Weis (258 respondents). Walmart and Target both had over 10,000 respondents.
Respondents to these sites are self-selecting and thus the data cannot be considered to have been gathered from a random sample of employees. For the 14 companies in our data, the correlation between Glassdoor and Indeed is 0.96.
Productivity Component
We use data reported in 10-K filings with the S.E.C. to create the Productivity Score. In creating the Productivity Score we look at how well retailers manage their three big assets: space, labor, and inventory.
The following graphs show the distribution of U.S. Food Retailer’s productivity measures in FY2014.
Because the correlation between different measures of productivity are not very high, we also ran the Good Jobs Score using three separate measures of productivity instead of combining them into one productivity measure. The results were very similar. The main changes were:
-Publix’s score fell below that of Kroger’s, placing Kroger as #3 and Publix as #4
-Sprouts’s score fell below that of Safeway’s, placing Safeway as #6 and Sprouts as #7
-Target’s score fell below that of Roundy’s, placing Roundy’s as #11 and Target as #12.
Below, we describe each of the measures and highlight some of the challenges associated with them. Although the metrics we use are far from perfect, they are easy to interpret, are available across all companies, and provide a starting point for evaluating productivity differences across different retailers. Our hope is that when companies disclose more and better operational data we will be able to incorporate it into our analysis to better assess productivity.
Space Productivity
We use sales/sqft as the measure of space productivity. Below are some challenges associated with this measure:
- 1. Inconsistency in square footage reporting:
Companies are required to report square feet, but very few details come with this measure. Two of the 14 companies we researched provided square footage data specifically about selling space; others simply reported the average store square footage. For consistency, we relied on average square footage per store. As stores dedicate different percentages of their square footage to storage and selling space, we believe it is likely that these discrepancies affected our measure of sales/sqft.
See this PDF file for detailed information about U.S. Food Retailer’s square footage disclosures. - 2. Differences in location strategies:
Companies that choose to locate in urban, high-traffic areas pay higher rent and are expected to have higher sales/sqft than those that choose to locate in suburban locations and pay less rent. Our measure does not take rent/sqft into account.
Inventory Productivity
We use inventory turnover (cost of goods sold/average inventory level) as the measure of inventory productivity. Because companies use different valuation methods for their inventories, we adjust all companies’ inventories and costs of goods sold (COGS) to FIFO by adding the LIFO reserve back to the inventory and reducing COGS by the year-over-year change in the LIFO reserve. The following companies report a LIFO reserve and are therefore subject to this adjustment: KR, PUSH, SWY, WMK, WFM, COST, TFM, and RNDY.
Below are some additional challenges associated with this measure:
- 1. Inconsistency in COGS reporting:
- Transit and Storage Costs — all supermarkets researched include costs associated with procuring the inventory – inbound and outbound shipping costs and storage costs. Storage costs could include rent, property taxes, and insurance, among others. We suspect that these storage costs, and perhaps even the transit costs, are not comparable and that it is likely they materially impact the reported COGS.
- Labor Compensation – While many companies count labor compensation and benefits as strictly part of SG&A expenses, some include the compensation and benefits of employees at the storage facilities as part of COGS.
- Rebates, Discounts, and Advertising – Supermarkets also receive rebates and bulk discounts from vendors. Some companies realize these benefits at the point of sale and include them in COGS; others do not. Likewise some companies include advertising and promotional expenses as part of COGS.
- Depreciation – Lastly, some companies realize depreciation of their inventory in COGS while other realize this as part of SG&A.
- See this PDF file for detailed information about U.S. Food Retailer’s COGS disclosures.
- 2. Differences in merchandise mix:
Companies vary in their mix of products. For example, companies like Walmart, Target, and Costco include products such as electronics and furniture that are expected to have lower turnover than grocery items.
Labor Productivity
We use sales per total number of employees as the measure of labor productivity.
- 1. Inability to measure employee hours:
Ideally, we would have liked to use number of employee hours as the denominator. However, retailers do not report this information. Of the 14 companies we evaluated, only five reported the percentage of employees that were full-time. There was also no data shared about the average number of hours worked by full- and part-time employees. Retailers also do not report their store payroll dollars spent. This metric is typically included as part of SG&A. - 2. Failure to separate headquarter and store employees:
We suspect that total number of employees includes headquarters employees, not relevant to store metrics. But retailers do not report non-store employees separately. - 3. Differences in business models:
Costco and Walmart’s Sam’s club are expected to have higher labor productivity because of their warehouse club business model. - 4. Understaffing the stores to show high sales/employee:
Retailers may report high sales/employee for some time periods simply by reducing the # of employees and understaffing their stores.